High Quality Low Beam Distribution
What is a good low beam pattern?
This is ultimately a timeless question amongst the headlight enthusiasts community. To understand which are truly critical qualities, we must first learn to evaluate the information obtained from measuring the beam on a wall, and how we can apply to better beam distribution on the road.
To start, I would like to display the below 3 samples of projector beam patterns: The kind is most commonly seen in internet forum posts and everybody’s favorite, “full beam wall shot”
Given conditions as of this starting point are
- Peak intensity
- Where is that peak at in (x,y) position
- And of course, lowered exposure wall shot image to observe how hot spot zone looks like
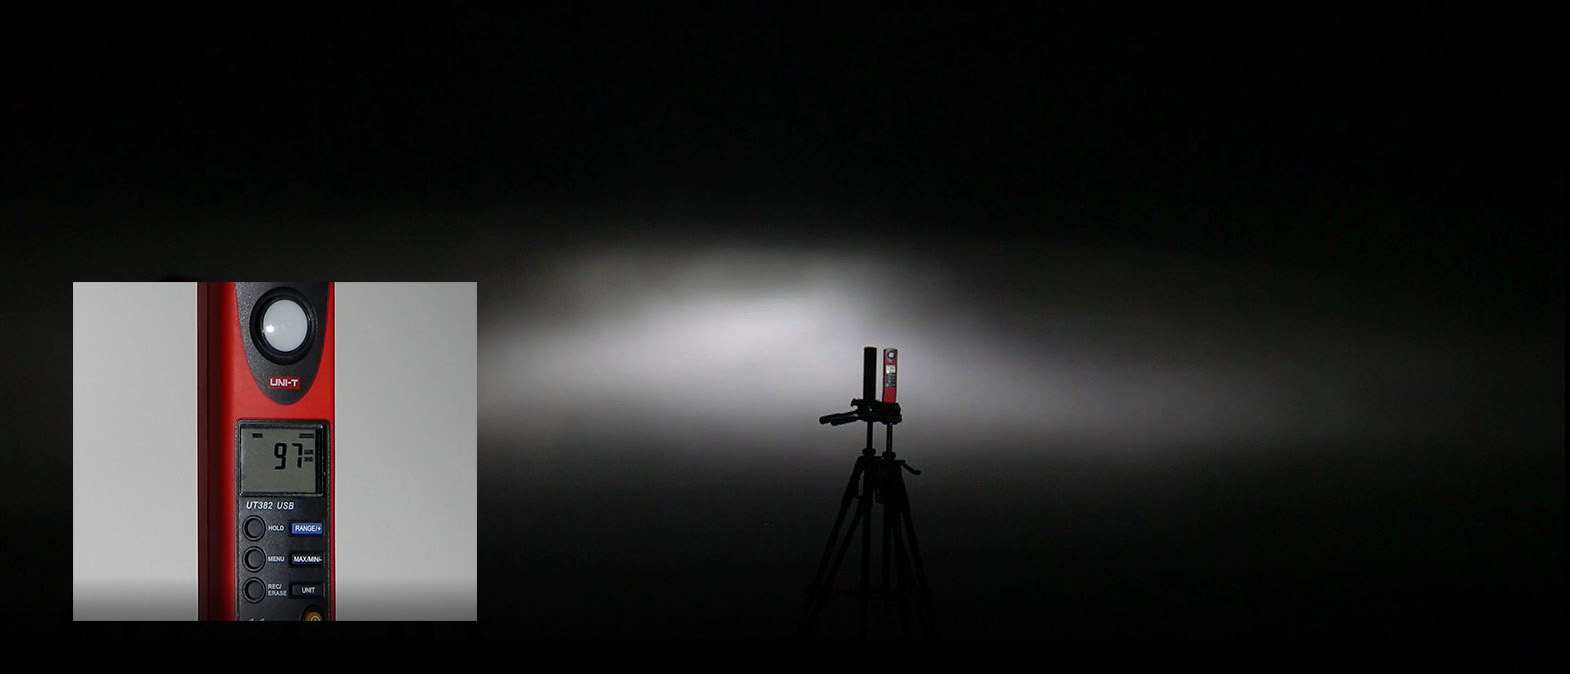
Thanks to much more popularly available lux meter on the market nowadays, we now can obtain objective information to make, “objective evaluation”.
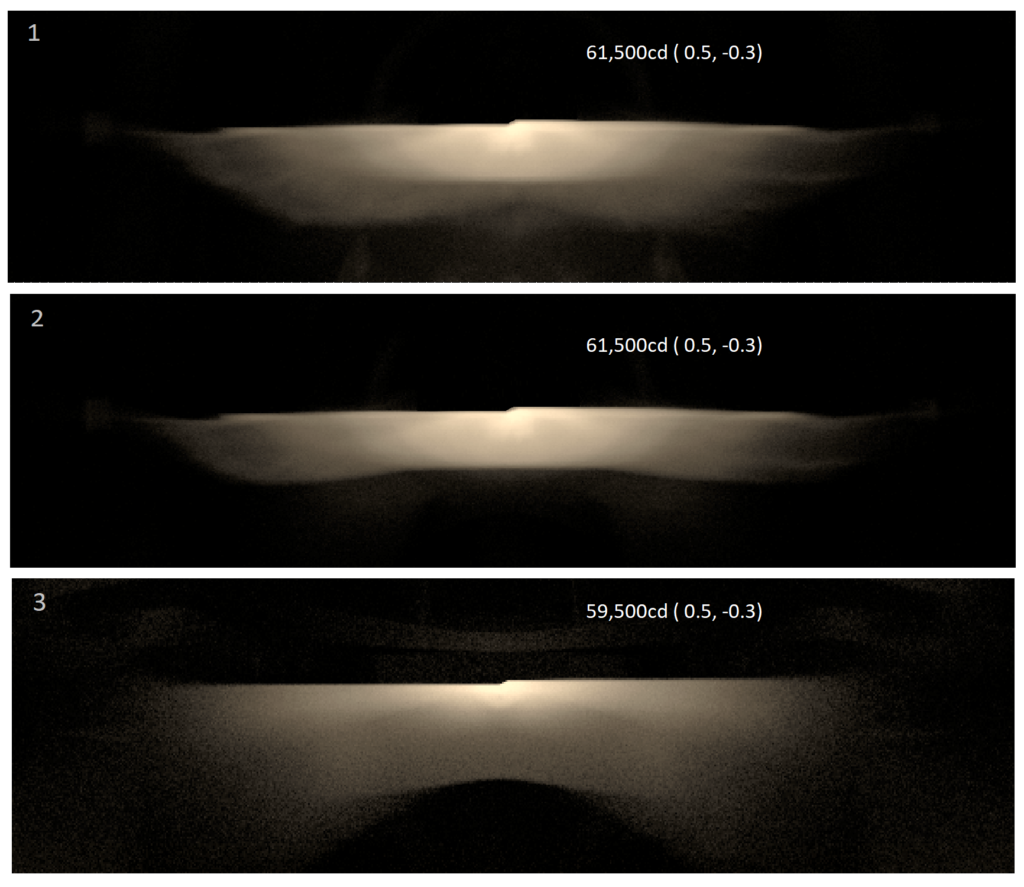
**All of 3 projector beams are aimed identically.
Projector 1: HID projector
Peak beam intensity = 61,500cd at (0.5, -0.3)
Projector 2: Projector 1 + Foreground limiter plate
Peak beam intensity = 61,500cd at (0.5, -0.3)
Projector 3: LED low beam projector
Peak beam intensity = 59,500cd at (0.5, -0.3)
And all have about -40 to 40-degree horizontal beam span.
Using the given information, which is your most favorite beam pattern, and what is the logic behind your selection?
Most of the positive feedback was gathered with samples 1 and 2, and the reasons being:
- Stronger peak intensity right at the elbow point area, (an indication of good distance throw.)
- Strong, ample amount of hot spot zone, powerful illumination.
- A streak of light focuses along the cut-off line to help distance width.
- Sample 2 was also supported by some additional feedback; less foreground spread to help viewing distance.
- Strong, ample amount of hot spot zone, powerful illumination
However, 3 did not gather much of a positive response other than the beam appearing more full, some mentioned it to have too much foreground spread, causing an appearance of fullness but the hot spot being a bit small. Not a very powerful impression.
A visual translation of wall shot into road illumination:
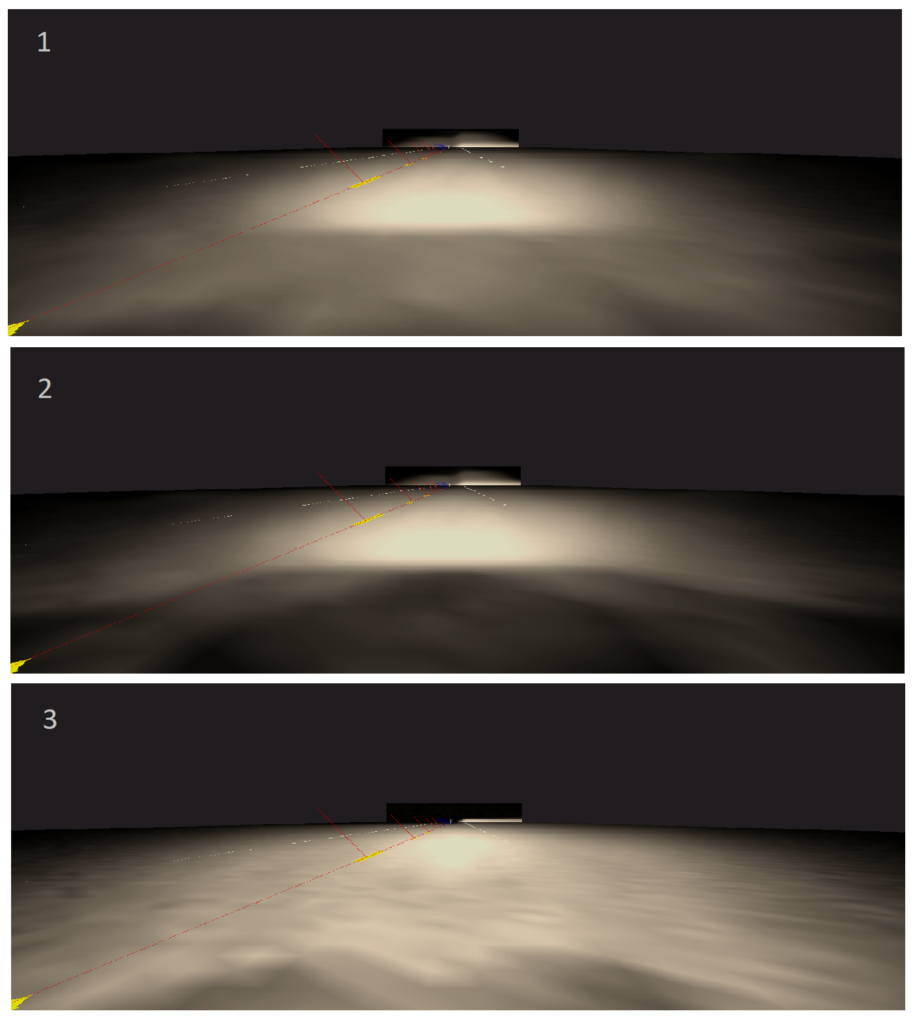
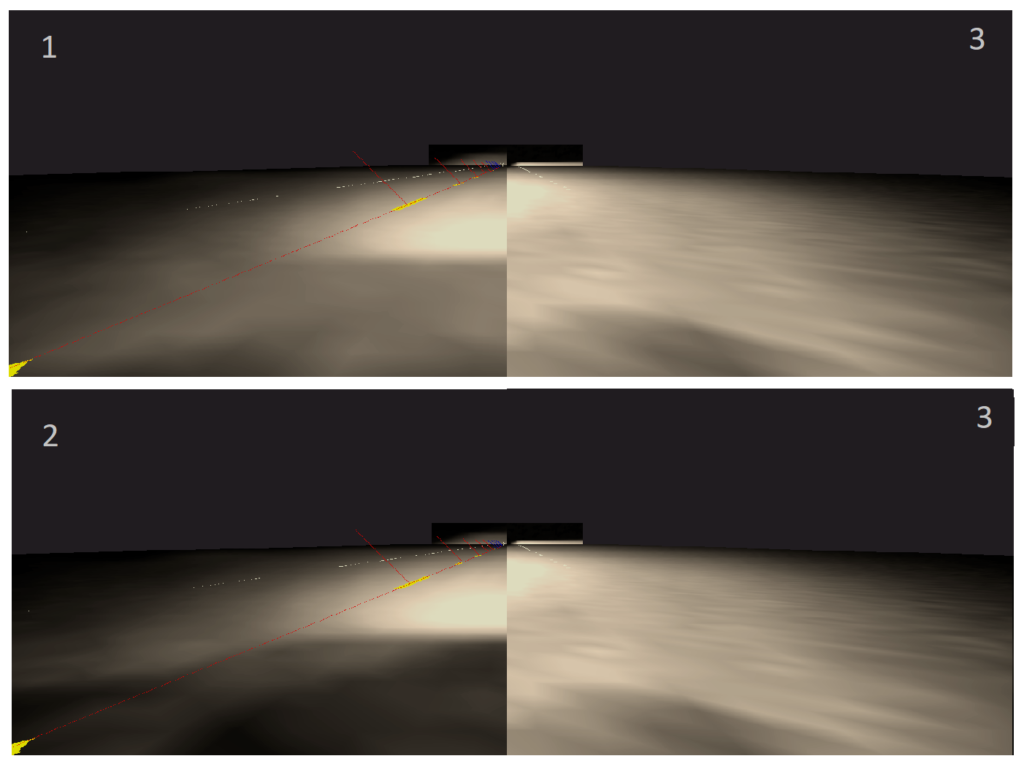
I see an interesting perspective difference in the road illumination images.
What happened here? It appears that all of the reasoning we have gathered does not seem to add up according to the logic we gathered from feedback.
Why does sample 3 show a stronger distance view quality? Which evaluation went wrong from the wall shot analyzed? Nothing is actually wrong with the evaluation. They all still present in the road illumination view.
However, we just did not have enough information.
The critically missing variant is called “proper beam intensity gradient curve”. In other words, a proper beam distribution balance.
Understanding the relationship between wall shot and road illumination
This is where Lux, Candela, and trigonometric function takes importance in the understanding of illumination effect.
Lux is an illuminance unit, in short, how well a surface is illuminated. This is determined by the light source’s solid angle intensity (candela) and projected distance.
Lux=Cd/m² Cd=m² x lux
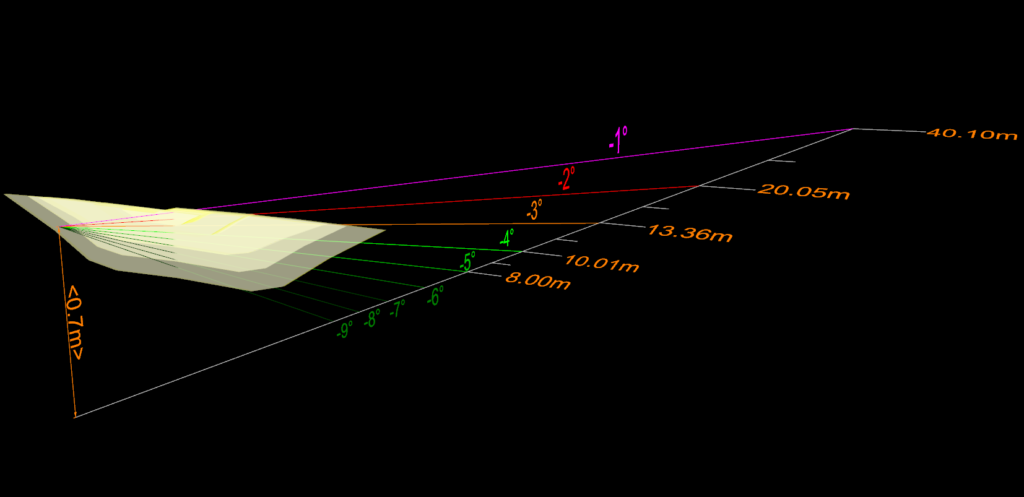
To understand ground illumination, the first step is to calculate the vertical angle in correspondence to the ground distance reach. When, for example, a headlamp is placed at 0.7m of height, -1 degree of a beam will land on the ground approx. 40.1m of distance from the lamp. -2 degree point will land on the ground approx. 20.05m of distance from the lamp
This ground distance can be calculated by the height of lamp(m)/-1 x tanθ
Hypotenuse distance can be calculated by the height of lamp (m)/-1 x sinθ
Wall shot beam character analysis
To simplify the case study, we focus on the vertical axis beam intensity spread. The target here is to learn how vertical angle beam intensity gradients behave on ground illumination. Below is the chart for sample 1~3 vertical axis measured numbers.
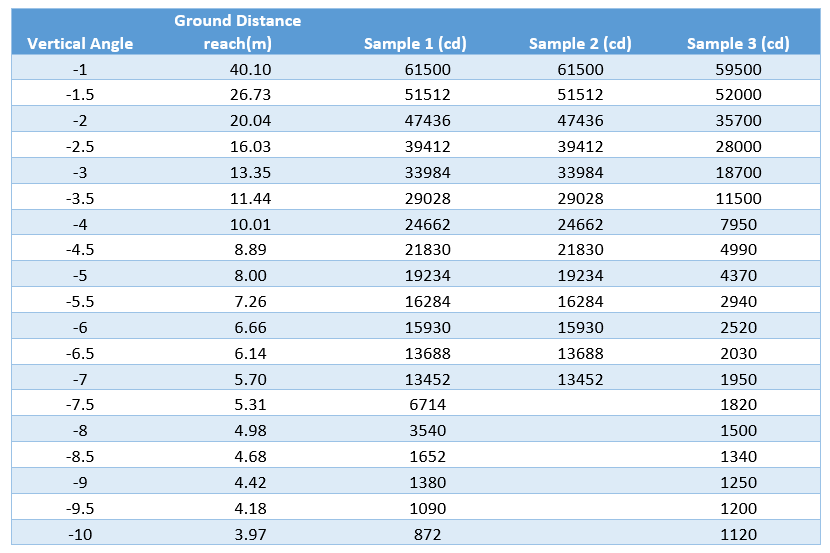
To visualize the above tables below is the vertical angle vs the measured candela reading of the 3 sample projector-beam patterns. Samples 1 and 2 share the same gradient curve except for the physical foreground limiter cut off of the lower angle beam than -7 degree.
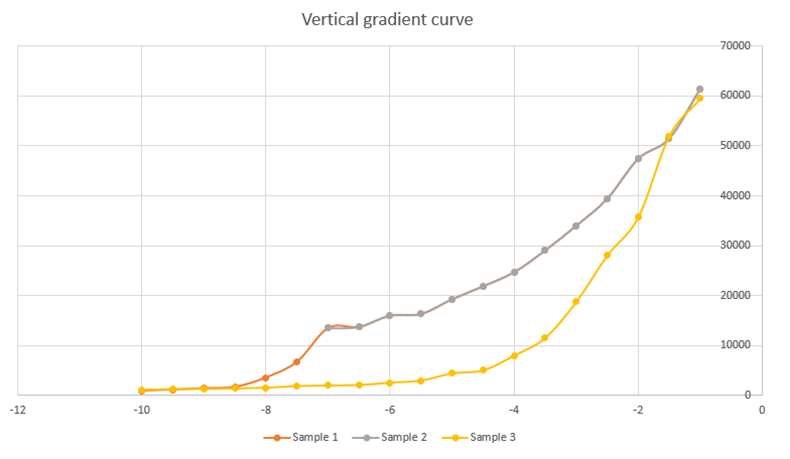
What we visually can learn from this chart is that samples 1 and 2 have more common liner curves, a small hump at -7 degree point. Contrast to samples 1 and 2, Sample 3 carries much more like an exponential logarithmic curve.
Based on the projector height being 0.7m from the ground, each angle of correspondence will look like the below chart. Hypotenuse distance to the corresponding ground landing point of each vertical angle can be calculated by 0.7/-1 x sinθ. With distance given now, we can obtain the ground illumination level defined by lux by Cd/m²
Ground lux spread over vertical angle corresponding distance
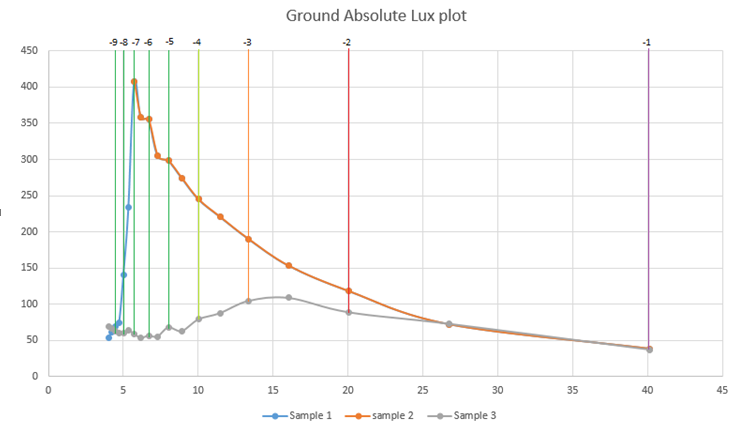
This curve indicates absolute lux reading at each vertical angle in accordance to the ground distance landing point.
The chart is showing us that samples 1 and 2 show exponentially strong illumination, which peaks at -7 degree point, which is equal to approx. 5.7m from the projector at as much as 400+ lux.
While sample 3 peaks at a -2.5 degree point, which is approximately 16.05m from the projector at just above 100 lux.
This essentially indicates that samples 1 and 2 will cause over-illumination at near distance compared to sample 3.
Despite an absolute lux number is much higher on samples 1 and 2, when illumination exposure is beyond our vision intake threshold, then the relative strength of lux distribution over distance takes a dominant effect. As a result, what vision impressions we will receive from each sample will be layout as below chart.
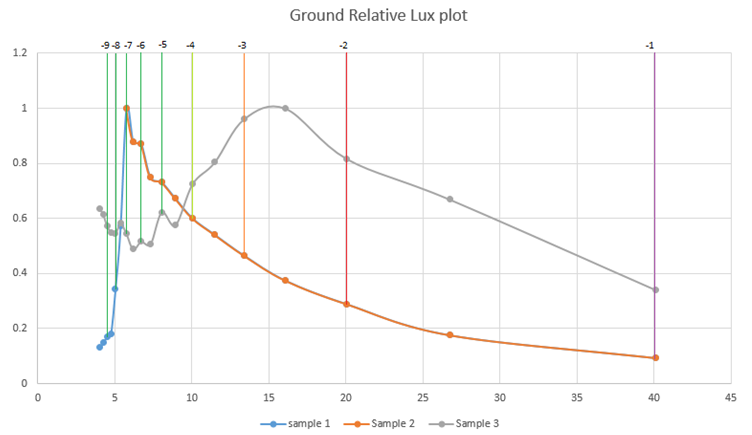
Samples 1 and 2 will give us the impression of farthest illumination as 9.4% of peak illuminance, which is pulling your view focus image strongest at -7 degree = 5.7m of near distance.
While sample 3 gives us about 34% of peak illuminance at the farthest-reaching area. Which is more than 3 times of the relative strength impression difference compare to sample 1 and 2. Peak illuminance is registered at around -2.5 degree = 16.05m from driver view.
This is the exact reason why the road illumination images of samples 1 and 2 show less distance illumination despite having much higher illuminance over the overall measured distance.
What would an ideal vertical gradient look like?
To understand the theoretical concept of the desired vertical gradient, we first must define the hypothetically illustrated desired illumination plot based on a projector that produces 60,000cd peak intensity that is aimed at -1 degree, positioned at a height 0.7m. at any distance above 70% of illuminance uniformity. For instance, the layout relative lux plot as to the below case study.
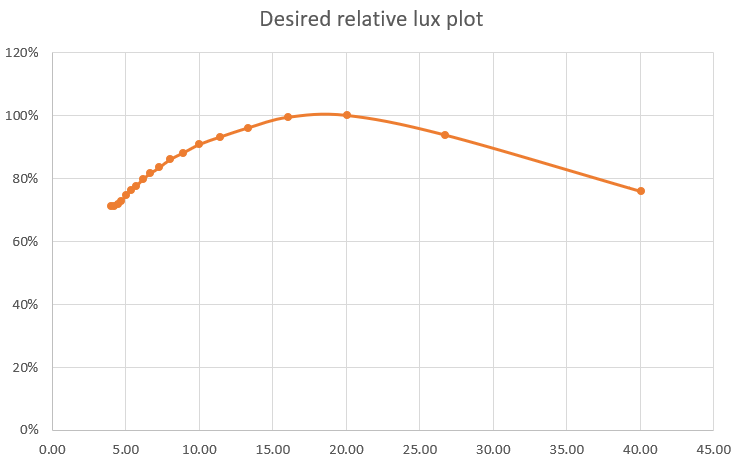
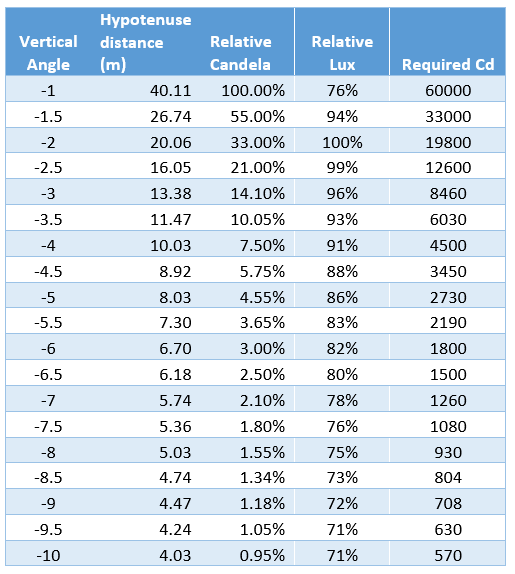
By inputting the relative lux spread into the below table, we can calculate the required candela level per vertical angle. Relative candela shows calculated the desired candela spread across the vertical angles.
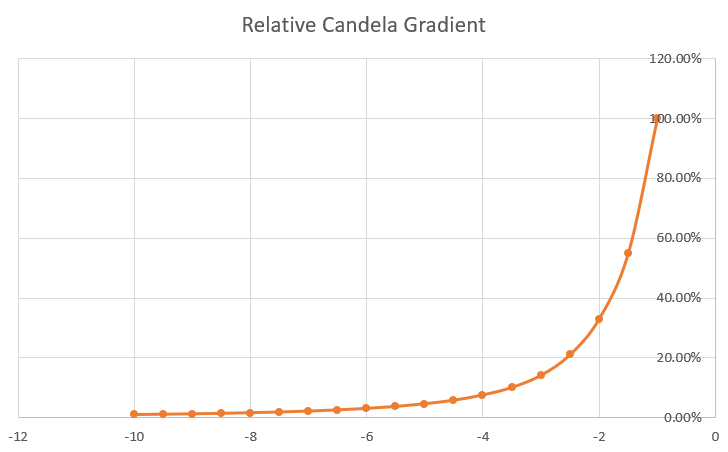
The below relative candela gradient chart shows the visual reference of how desired vertical gradient should look, which is a smooth exponential logarithmic curve.
For example, if your selected projector’s wall shot image ( aimed at -degrees) revealed peak intensity to be 55,000cd, -1-degree vertical angle decrease, which is at -2 degree point should measure no more than 33% of the peak intensity, which is 55,000cd x 0.33=18,150cd to prevent 20m distance illuminance level to exceed 40m distance illuminance level. And this tendency shows the exponentially higher impact, especially below the -4 degree point.
** it is important to understand the aim of lamp changes the required gradient curve. Lower aimed scenarios require a less steep gradient curve.
What is foreground illumination?
For this consideration, FMVSS 108 regulation limits -4D 4R measuring spot as foreground area illumination level.
In this sample aiming configuration, -4 degree corresponds to 10m of distance from the projector.
Proper foreground illumination control is not to physically trim off any below -4 degree range of illumination, but it is to control a proper vertical gradient preventing the relative strength of illuminance below -4 degree point to excessively overpower the rest of the above range.
In other words, regardless of the size of the vertical spread, as long as the vertical gradient is designed properly, the size of the foreground illumination does NOT conflict distance view.
Considering that every application to have different headlamp installation heights and aiming allowance ranges, foreground illumination strength at -4 degree is desired to be under 8-15% of peak intensity.
Summary
By evaluating the vertical intensity gradient curve, we can add a highly useful evaluation factor into beam quality analysis. While it is not strictly required to have a certain set level of exponential logarithmic curving, having a smooth exponential-like vertical gradient curve should carry a much higher priority role in beam quality contribution than the single solid angle of peak intensity.
In short, the basic definition of high-quality low beam distribution can be summarized as:
- To have adequate peak intensity right at the near elbow point area
- Vertical gradient shall have a smooth exponential logarithmic curve.
- Foreground illumination strength at -4 degree is desired to be under 8-15% of peak intensity in general.


.png?width=300&height=87&name=logo%20(1).png)